
Introduction
The Dynamic Defense dashboards are part of All Dashboards in Branch. Use them to track fraud detection and prevention performance across your campaigns and ad partners, see which events Dynamic Defense blocked or tagged, and monitor the impact of your fraud protection rules to optimize the quality of your ad spend.
There are three Dynamic Defense dashboards:
| Dashboard | What it shows |
|---|---|
| Dynamic Defense | Blocked events by ad partner, including blocked revenue. |
| Dynamic Defense - Blocked Events | Events your blocking rules excluded, by ad partner, campaign, country, event, and reason. |
| Dynamic Defense - Tagged Events | Events your tagging rules flagged as invalid but kept in your standard reporting, by the same breakdowns. |
To open the blocked or tagged events dashboards, select Dynamic Defense Analytics in the top-right corner of the Dynamic Defense page, and then choose Blocked traffic or Tagged traffic. You can also find all three under Analysis > All Dashboards. They replace the legacy Fraud → Activity reporting page.
Tip: new to Analysis Dashboards?
This article assumes basic familiarity with dashboards, widgets, and Ivy. For a full introduction, including how to create widgets, set filters, download data, and set KPI alerts, read the Dashboards Overview.
Access
Branch creates the Dynamic Defense dashboards for you. Like other Branch-created dashboards, you can't edit or delete them, but you can make a copy and customize your own version.
The dashboards you see depend on your Branch package. Please contact our Sales team to learn more.
Dynamic Defense dashboard
Events blocked
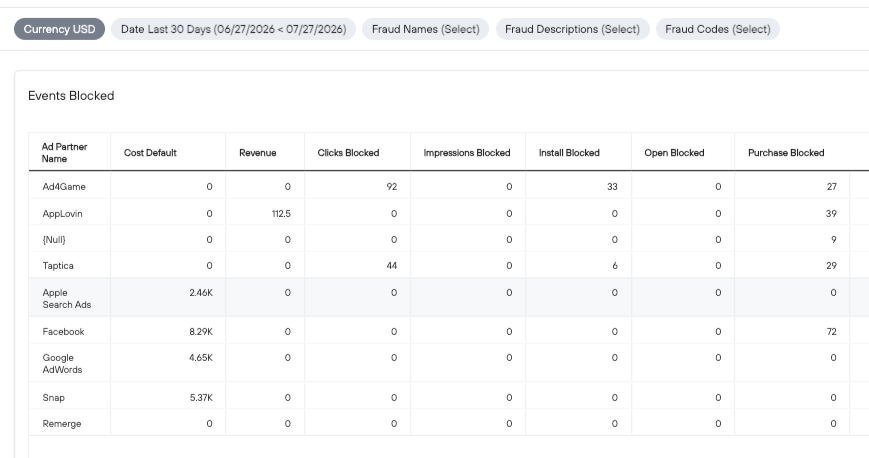
The Events Blocked widget breaks down the events your blocking rules excluded, by ad partner. For each ad partner, it shows:
| Column | Definition |
|---|---|
| Ad Partner Name | The attributed ad partner. Events without an attributed partner appear as {Null}. |
| Install Blocked | Total count of blocked Install events. |
| Clicks Blocked | Count of blocked clicks on links. |
| Open Blocked | Total count of blocked Open events. |
| Impressions Blocked | Total count of blocked impressions. |
| Purchase Blocked | Total count of blocked Purchase events. |
| Revenue Blocked | The revenue from blocked Branch Commerce Events. |
Use this table to spot which partners are sending you invalid traffic. A partner with a high proportion of blocked installs or purchases is a strong candidate for a conversation about traffic quality.
Dashboard filters
The filter bar at the top of the dashboard lets you narrow down the data:
- Currency: Currency that revenue is reported in (default
USD). - Date: The reporting window (default last 30 days).
- Fraud Names: Name of the fraud signal associated with the event. Multiple rules or signals can tag the same event.
- Fraud Types: The type of fraud detection rule that flagged the event.
- Fraud Codes: The code of the fraud detection rule that flagged the event.
Because more than one signal can flag an event, some values in these filters appear as comma-separated combinations. Selecting one matches only the events flagged by that exact set. To look up what any signal means, see the Dynamic Defense Signals Reference.
Blocked events dashboard
The Dynamic Defense - Blocked Events dashboard shows how many events your blocking rules excluded and where they came from. It includes these widgets:
| Widget | What it shows |
|---|---|
| Total Blocked Events | The total count of blocked events. |
| Most-blocked: Ad Partner | The ad partner with the most blocked events. |
| Most-blocked: Country | The country with the most blocked events. |
| Most-blocked: Branch Event | The event type with the most blocked events. |
| Blocked Events by Ad Partner: Top 10 | The 10 ad partners with the most blocked events. |
| Blocked Events by Campaign: Top 10 | The 10 campaigns with the most blocked events. |
| Blocked Events: Trend | Blocked events by day. Use filters and drill downs to narrow the data. |
| Blocked Events: Reason | Blocked events by ad partner, event, fraud type, and fraud name, so you can see why events were blocked. |
Filters: Date (default last 30 days), Branch Channel (default ADS), Attributed, Platform, Event Name, Ad Partner Name, Campaign Name, Secondary Publisher, and Currency.
Tagged events dashboard
The Dynamic Defense - Tagged Events dashboard shows events your tagging rules flagged as invalid. Tagged events stay in your standard reporting and attribution, so this dashboard is built on the Activity data source and counts events where Fraud Suspicious is true. It includes these widgets:
| Widget | What it shows |
|---|---|
| Total Tagged Events | The total count of tagged events. |
| Most-tagged: Ad Partner | The ad partner with the most tagged events. |
| Most-tagged: Country | The country with the most tagged events. |
| Most-tagged: Event | The event type with the most tagged events. |
| Tagged Events by Ad Partner: Top 10 | The 10 ad partners with the most tagged events. |
| Tagged Events by Campaign: Top 10 | The 10 campaigns with the most tagged events. |
| Tagged Events: Trend | Tagged events by day. Use filters and drill downs to narrow the data. |
| Tagged Events: Reason | Tagged events by ad partner, event, fraud type, and fraud name, so you can see why events were tagged. |
It uses the same filters as the Blocked Events dashboard.
Blocked events data source
The Activity Fraud data source powers the blocked events reporting. It includes:
- Blocked measures: Blocked counts (total and unique) for clicks, impressions, installs, opens, reinstalls, purchases, and the full range of Branch Standard Events, for example,
Install Blocked,Purchase Blocked Unique, and aggregate measures likeTotal Count Blocked. - Fraud dimensions: Attributes that identify how Dynamic Defense flagged an event, including
Fraud Names,Fraud Types,Fraud Codes,Fraud Suspicious, andFraud Suspicious Attribution. - Standard dimensions: The attribution dimensions you use elsewhere in Analysis, like
Ad Partner Name,Campaign Name,OS,Geo Country Code, andEvent Name.
For the complete list of fields, see the Activity Fraud data source reference.
You can build your own widgets from the Activity Fraud data source, in a copy of a Dynamic Defense dashboard or any dashboard you create. When creating a widget, select Activity Fraud from the data sources menu.
Where tagged vs. blocked data lives
Dynamic Defense rules can tag or block events, and the two show up in different places in your reporting:
| Action | Where it appears |
|---|---|
| Tagged events | Remain part of your standard activity reporting and attribution using the Activity data source in Analysis, or using the Custom Exports API. Use fraud dimensions like Fraud Names and Fraud Suspicious to identify, filter, or group tagged traffic within your reporting. You can also use the Dynamic Defense - Tagged Events dashboard. |
| Blocked events | Excluded from attribution and standard reporting. They're reported through the Activity Fraud data source and the Dynamic Defense dashboards, so you retain full visibility. |
Ask Ivy about fraud
Like every Analysis dashboard, the Dynamic Defense dashboards include an Ask Ivy prompt at the top of the page. Use it to analyze your fraud data in plain English. Some prompts to get you started:
- Which ad partner had the most blocked installs in the past 30 days?
- Show me blocked purchases by fraud name this month.
- Compare blocked clicks by ad partner week over week for the past 9 weeks.
- What share of my installs from each partner was blocked this quarter?
- Show me blocked events by country for my top 5 campaigns.
For tips on getting the best answers, read Craft prompts for Ivy.
Tip: spike notifications
Set a KPI alert on a fraud widget to get notified when blocked traffic spikes. For example, when blocked installs cross a threshold. A sudden spike often means a partner or campaign has started sending invalid traffic.
FAQ
Why don't blocked events appear in my other dashboards?
We exclude blocked events from attribution and standard activity reporting by design. They're reported through the Activity Fraud data source, which powers the Dynamic Defense dashboards.
How do I see tagged (not blocked) suspicious traffic?
Open the Dynamic Defense - Tagged Events dashboard. Tagged events also stay in your standard Activity reporting, so you can use the fraud dimensions, like Fraud Names or Fraud Suspicious, to filter or group your own reports by tagged traffic.
Can I edit the Dynamic Defense dashboards?
No. They're Branch-created dashboards, so you can't edit or delete them. To customize one, make a copy and edit your copy.
Where do I configure the rules that decide what gets blocked?
Select Dynamic Defense in the left-side navigation to configure fraud rules. See the Dynamic Defense guide.