
Attention
Branch's new experience is rolling out in phases, so your interface may differ. This article covers a legacy analytics feature. For the new version, see Analysis Overview.
Overview
The Branch Ads Analytics Dashboard has two main sections: a high-level graph at the top and a detailed table below. Each view allows filtering and comparing in-app and web events by analytics parameters associated with your Branch Ad Links.
When creating a Branch Ad Link, you include a campaign, channel, and tags, and Branch will automatically add a feature and ad partner for filtering events.
Warning
Branch limits all dimensions to 40,000 values per publisher per day. This means that you can only see up to 40,000 unique campaigns, ad names, etc. in the Branch Dashboard.
If an app tries to send more than 40,000 values for a single dimension (e.g. ~campaign) in a day, then Branch stops tracking those unique values. Branch combines additional values together and buckets them under the value "Other".
Warning
Adding ad partner, country, secondary publisher, and OS in the Compare by field will cause an error in loading data into the Events/Performance Table.
Dimensions
Branch integrates with many different ad partners, each with their own requirements and capabilities. Use this section to learn more about which dimensions are supported for which ad partner, and how to combine different dimensions in your reports.
Supported SAN dimensions
Self-Attributing Networks (SANs) do not always support all of the dimensions available in your Branch analytics.
Please refer to the following table when using Compare by dimensions:
| Dimension | Apple Ads | Snap | |||
|---|---|---|---|---|---|
| Feature | Supported | Supported | Supported | Supported | Supported |
| Channel | Unsupported | Supported | Unsupported | Unsupported | Supported |
| Campaign | Supported | Supported | Supported | Supported | Supported |
| Tags | Unsupported | Unsupported | Unsupported | Unsupported | Supported |
| Stage | Unsupported | Unsupported | Unsupported | Unsupported | Unsupported |
| Ad Partner | Supported | Supported | Supported | Supported | Supported |
| Secondary Publisher | Supported | Supported | Unsupported | Unsupported | Supported |
| Ad Set Name | Supported | Unsupported | Supported | Supported | Unsupported |
| Ad Name | Supported | Unsupported | Unsupported | Supported | Unsupported |
| Creative Name | Supported | Unsupported | Unsupported | Unsupported | Unsupported |
| Keyword | Unsupported | Supported | Supported | Unsupported | Unsupported |
| Last Touch Type | Unsupported | Unsupported | Unsupported | Unsupported | Supported |
| Link ID | Unsupported | Unsupported | Unsupported | Unsupported | Unsupported |
| Country | Supported | Unsupported | Unsupported | Unsupported | Supported |
| OS | Unsupported | Unsupported | Supported | Unsupported | Supported |
| Platform | Unsupported | Unsupported | Unsupported | Unsupported | Supported |
Dimension capabilities
Ad partner APIs often require Branch to make several sequential requests to retrieve all the data we surface to our customers.
Notably, not all dimensions are available for each request. Some are available in what we call “set A” and others are available in “set B”. Some are available in both, so they’re called “common”.
Warning
Sets A and B cannot be reconciled, so Branch defaults to set A if you select dimensions from both.
Branch’s recommendation when creating a report is to either:
- Use dimensions from set A, with any common dimensions you’d like or
- Use dimensions from set B, with any common dimensions you’d like
That is, we advise not combining dimensions from sets A and B when creating a report.
For details on which dimensions are in sets A and B, and which dimensions are common, use the lists in these tabs:
Apple
Note
Apple is referred to as a_apple in the Branch Dashboard.
Dimension Set A:
last_attributed_touch_data_tilde_keywordlast_attributed_touch_data_tilde_keyword_id
Dimension Set B:
last_attributed_touch_data_tilde_ad_namelast_attributed_touch_data_tilde_ad_idlast_attributed_touch_data_tilde_creative_namelast_attributed_touch_data_tilde_creative_id
Common:
last_attributed_touch_data_tilde_campaignlast_attributed_touch_data_tilde_campaign_idlast_attributed_touch_data_tilde_ad_set_namelast_attributed_touch_data_tilde_ad_set_iduser_data_osuser_data_platform
Not available:
last_attributed_touch_data_tilde_channellast_attributed_touch_data_tilde_secondary_publisheruser_data_geo_country_code
Note
Facebook is referred to as a_facebook in the Branch Dashboard.
Dimension Set A:
user_data_osuser_data_platform
Dimension Set B:
user_data_geo_country_code
Common:
last_attributed_touch_data_tilde_ad_namelast_attributed_touch_data_tilde_ad_idlast_attributed_touch_data_tilde_creative_namelast_attributed_touch_data_tilde_creative_idlast_attributed_touch_data_tilde_secondary_publisherlast_attributed_touch_data_tilde_campaignlast_attributed_touch_data_tilde_campaign_idlast_attributed_touch_data_tilde_ad_set_namelast_attributed_touch_data_tilde_ad_set_id
Not available:
last_attributed_touch_data_tilde_keywordlast_attributed_touch_data_tilde_keyword_idlast_attributed_touch_data_tilde_channel
TikTok
Note
TikTok is referred to as a_tiktok_(ads) in the Branch Dashboard.
Dimension Set A:
user_data_osuser_data_platform
Dimension Set B:
user_data_geo_country_code
Common:
last_attributed_touch_data_tilde_ad_namelast_attributed_touch_data_tilde_ad_idlast_attributed_touch_data_tilde_campaignlast_attributed_touch_data_tilde_campaign_idlast_attributed_touch_data_tilde_ad_set_namelast_attributed_touch_data_tilde_ad_set_id
Not available:
last_attributed_touch_data_tilde_creative_namelast_attributed_touch_data_tilde_creative_idlast_attributed_touch_data_tilde_keywordlast_attributed_touch_data_tilde_keyword_idlast_attributed_touch_data_tilde_channellast_attributed_touch_data_tilde_secondary_publisher
Google Ads
Note
Google Ads is referred to as a_google_adwords in the Branch Dashboard.
Dimension Set A:
last_attributed_touch_data_tilde_ad_id
Dimension Set B:
user_data_geo_country_code
Common:
last_attributed_touch_data_tilde_channellast_attributed_touch_data_tilde_secondary_publisherlast_attributed_touch_data_tilde_campaignlast_attributed_touch_data_tilde_campaign_idlast_attributed_touch_data_tilde_ad_set_namelast_attributed_touch_data_tilde_ad_set_iduser_data_osuser_data_platform
Not available:
last_attributed_touch_data_tilde_creative_namelast_attributed_touch_data_tilde_creative_idlast_attributed_touch_data_tilde_keywordlast_attributed_touch_data_tilde_keyword_id
Jammp
Note
Jammp is referred to as a_jammp in the Branch Dashboard.
Dimension Set A:
last_attributed_touch_data_tilde_ad_namelast_attributed_touch_data_tilde_ad_idlast_attributed_touch_data_tilde_creative_namelast_attributed_touch_data_tilde_creative_id
Dimension Set B:
last_attributed_touch_data_tilde_secondary_publisher
Note
Pinterest is referred to as a_pinterest in the Branch Dashboard.
Dimension Set A:
user_data_geo_country_code
Dimension Set B:
user_data_osuser_data_platform
Mintegral
Note
Mintegral is referred to as a_mintegral in the Branch Dashboard.
Dimension Set A:
last_attributed_touch_data_tilde_ad_namelast_attributed_touch_data_tilde_ad_id
Dimension Set B:
last_attributed_touch_data_tilde_secondary_publisher
GMP
Note
Google Marketing Platform is referred to as a_google_marketing_platform in the Branch Dashboard.
Dimension Set A:
user_data_geo_country_code
Dimension Set B:
user_data_osuser_data_platform
Impact Radius
Note
Impact Radius is referred to as a_impact_radius in the Branch Dashboard.
Dimension Set A:
last_attributed_touch_data_tilde_ad_namelast_attributed_touch_data_tilde_ad_id
Dimension Set B:
user_data_geo_country_code
Filter bar
At the top of the page, you'll see a menu of options that applies to both the graph and table views. With the filter bar, you can add attributes that will apply to both the graph and table views on this page.

You can apply the following attributes:
| Attribute | Description |
|---|---|
| Split SKAN data | When Split SKAN data is checked, your report will break your data into “non-SKAN”, “SKAN”, and “Total”. The total is the sum of non-SKAN and SKAN. |
| Organic | When Organic is checked, unattributed data will show (attributed: false). This data is not attributed to any click or impression, and is the same as "organic" or "direct" data. |
| Unique | When Unique is checked, these are unique to a user. For example: if 1 user clicks 100 times, it will count as 1. There is no concept of "unique revenue"; "revenue" is always the sum of all purchase events. |
| Dates | This is the date range for your report. By default, the Branch Dashboard will allow you to set the date range for up to 6 months back. |
| Ad Partner | Apply the Ad Partner filter to your report to only display data from specific ad partners. |
| OS | Apply the OS filter to your report to only display data from specific operating systems. |
| Campaign | Apply the Campaign filter to your report to only display data from specific campaigns. |
| Filters | Add additional filters that you apply to the report. |
| Reset | Reset the report back to a blank template. |
Trends graph
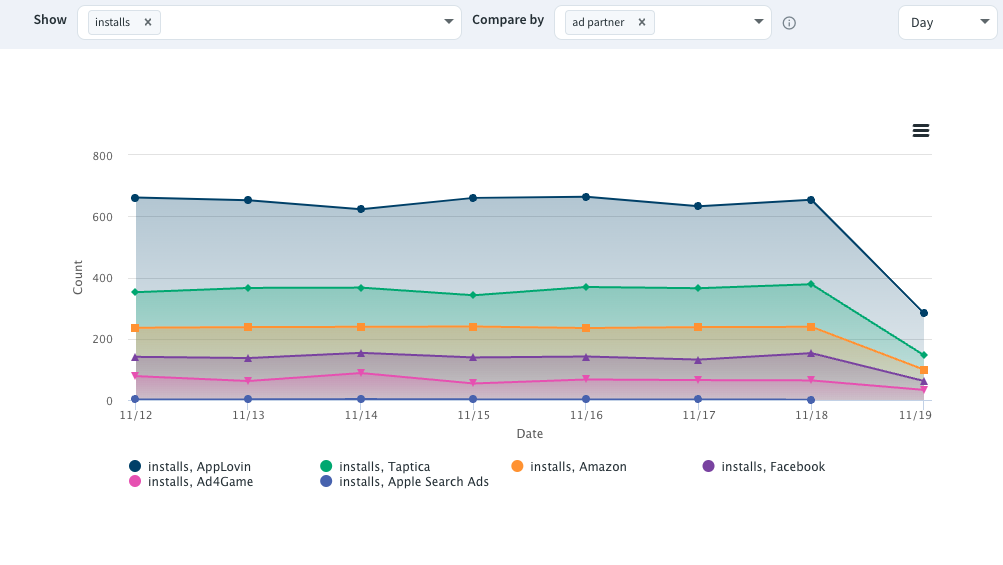
Here you can see a visual breakdown of where your various in-app and web events are originating from. See the appendix for a breakdown of each event and filter type. These events can be further filtered by the various analytics tags from their originating ad campaigns.
Caution
Warning
For iOS 14.5+, when the organic check-box is checked, the traffic being added to this view will include “true direct organic traffic plus misattributed first installs”.
This introduces double counting with the paid-attributed opted-in installs the page displays by default.
For additional information on changes post iOS 14.5, visit our FAQ Pages.
Events table
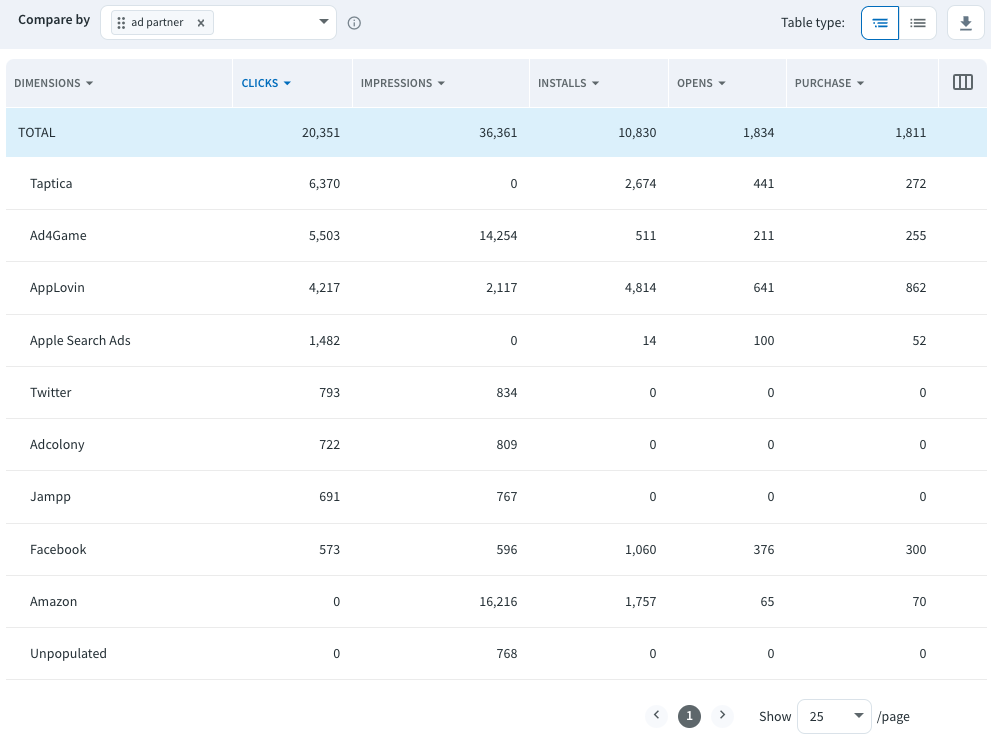
The Events table lets you see a more granular view of your event data. Here you can filter and compare fields while seeing a side-by-side view of your events.
Columns
You can use the three-column button on the top right of the table to customize the columns viewable in the table. You can customize your columns even further through the Column Selector.
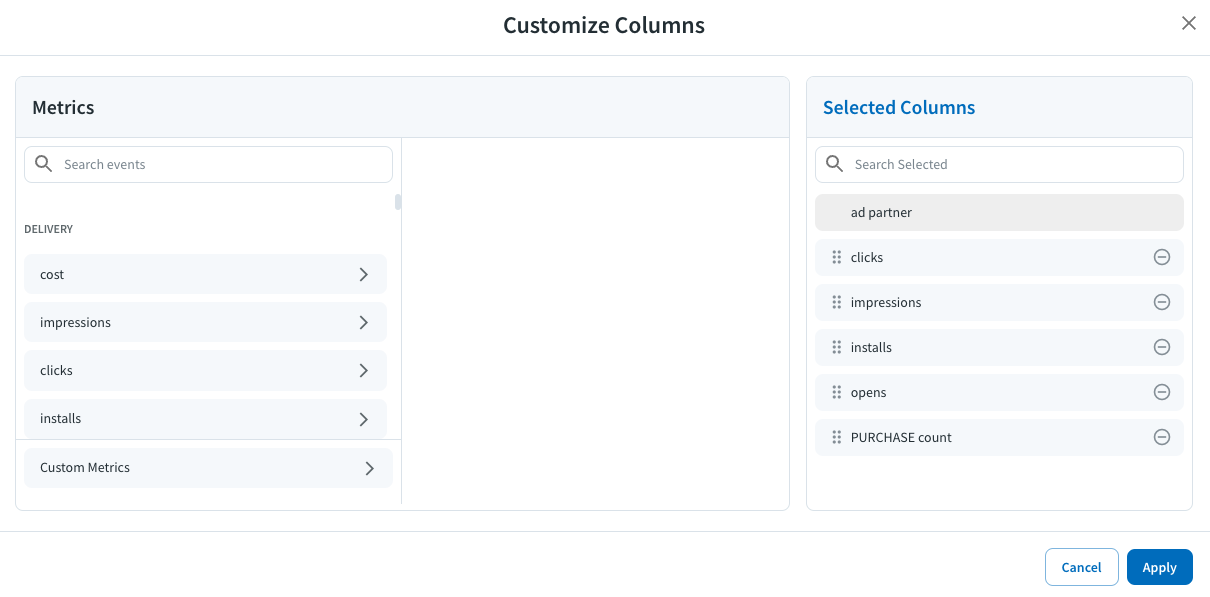
Events within each bucket are ordered by the volume received in the past 15 days. The most relevant events for each app will always appear at top of the list. You can also pin your favorite events and metrics to always appear on top.
Any event with zero volume will appear at the bottom irrespective of the event type.
Note
Below are the definitions for several percentage-related metrics:
- Click to Install %: The percentage of attributed installs divided by clicks. Installs with "last attributed touch type" of value
IMPRESSIONare filtered out. Installs with "platform" of valueDESKTOP_WEBandDESKTOP_APPare also filtered out. - Click to Open %: The percentage of attributed opens divided by clicks. Opens with "last attributed touch type" of value
IMPRESSIONare filtered out. Opens with "platform" of valueDESKTOP_WEBandDESKTOP_APPare also filtered out.
Custom metrics
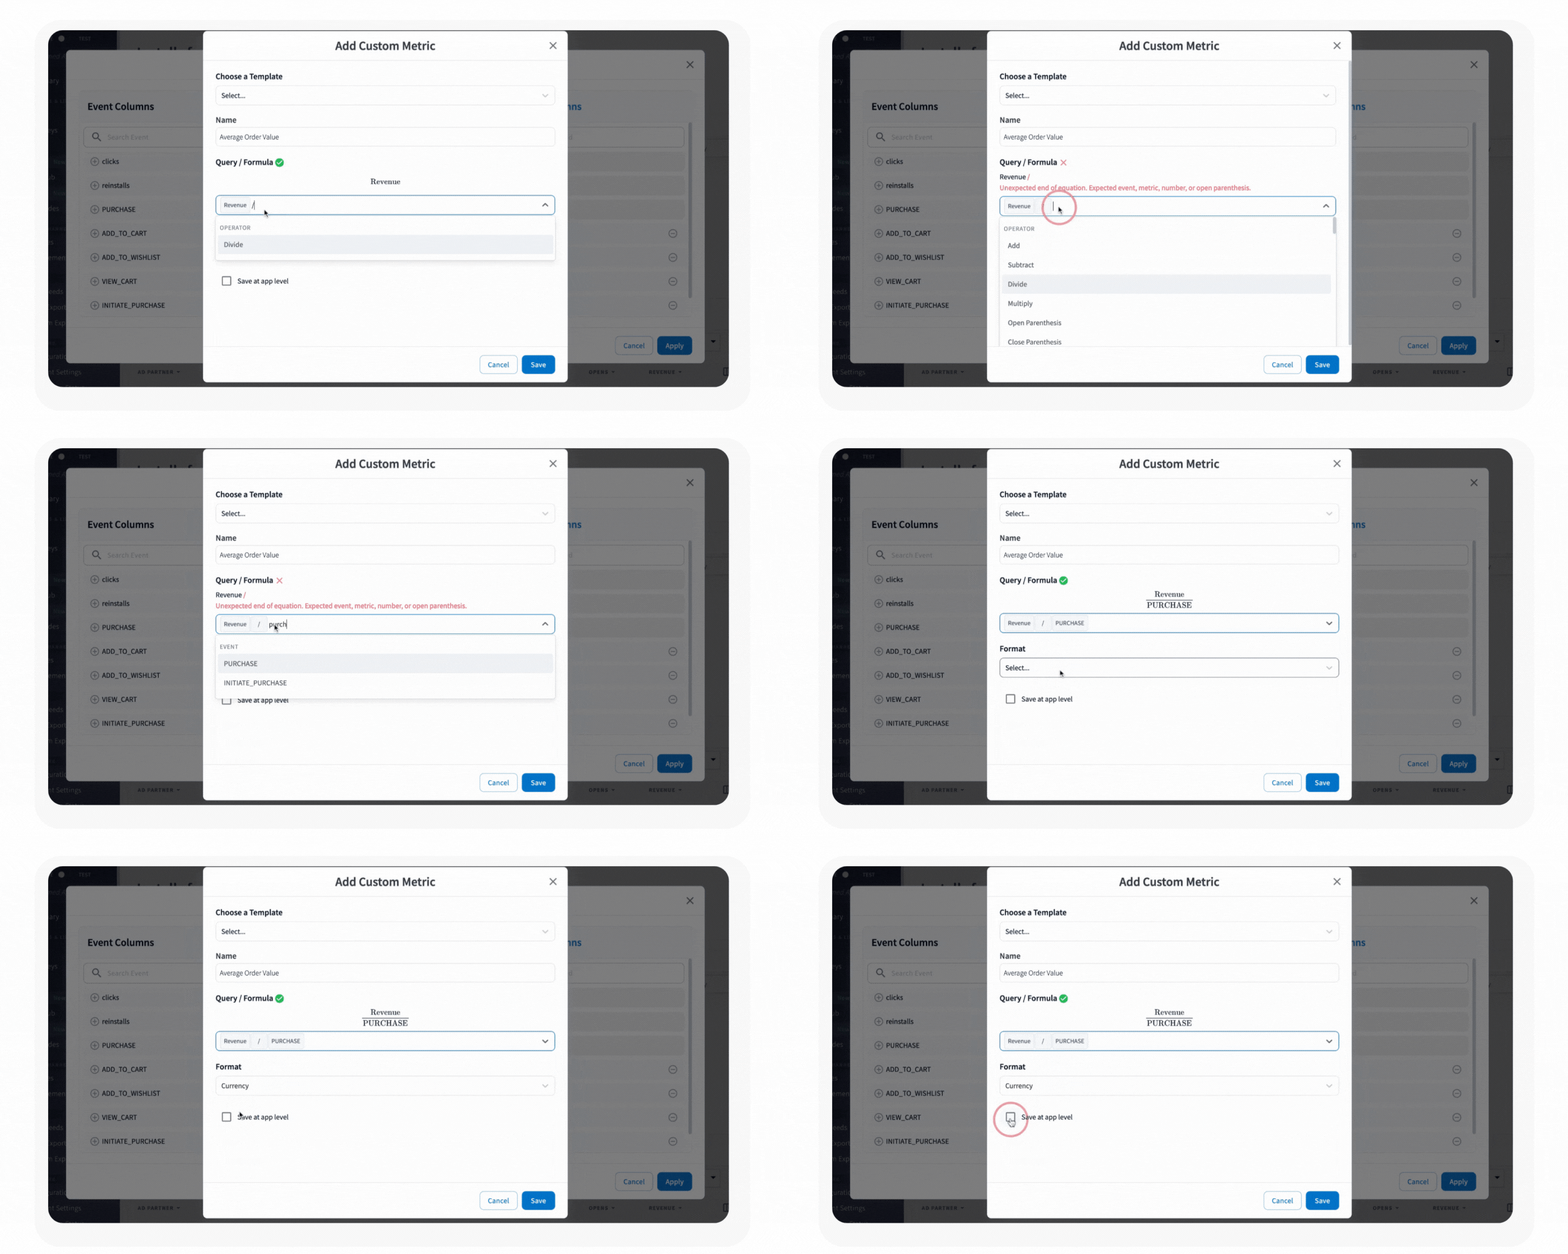
In the column selector, you can also make your own custom metrics for more insights from your aggregated data. Formulaic calculations between event counts and aggregations are supported. Additionally, you will have access to templated calculations like Average Order Value and Customer Acquisition Cost.
Drill-down analytics
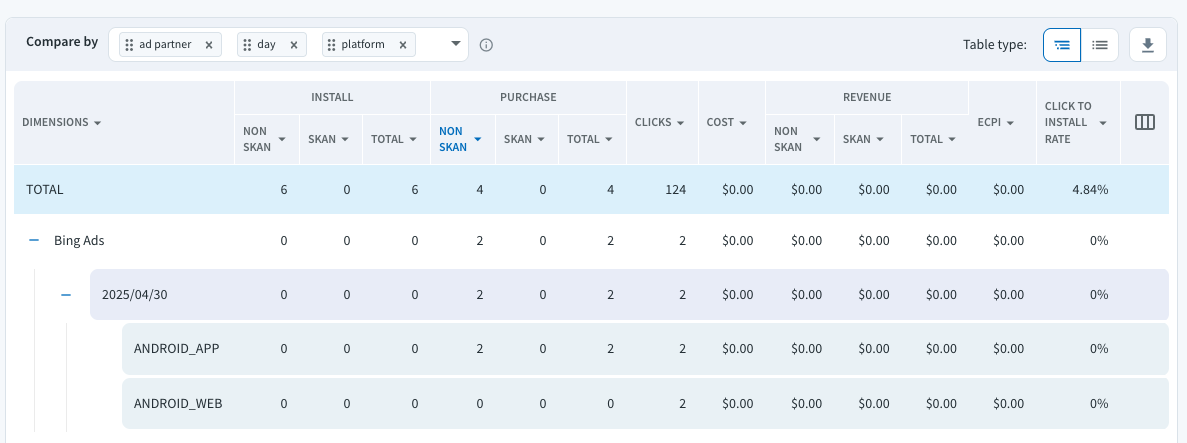
When you use the Compare by feature with multiple values, you will notice a plus icon appear in the rows of your table. Click the plus icon to expand these rows, which are separated by the different dimensions you provided.
In the example below, you can see ad partner, day, and platform are the chosen fields, and this is reflected in the Dimensions column of the table. The rows have been expanded, so you can see how each dimension is broken down.
Save views
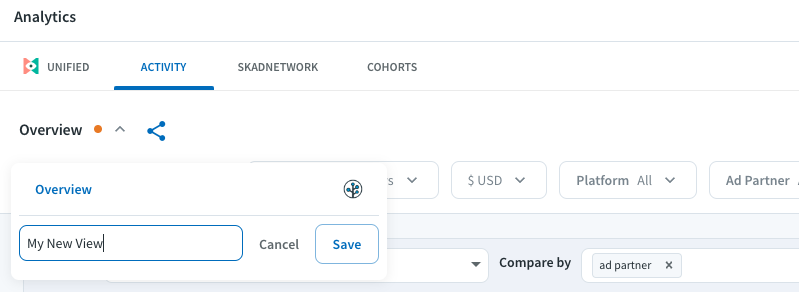
The Branch Dashboard allows you to save the state of your report after you've applied changes to your satisfaction. You can name and save your report for future use. This is helpful if you have several report types you use to analyze ads-related performance.
Share views
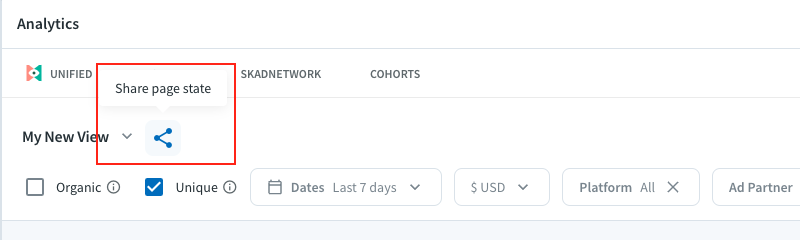
Clicking the three-dot share button next to the name of your report will generate a shareable link to your report. Anyone with read access to your Branch Dashboard will be able to click the link and be directed to the report you created.
Revenue and cost
Unique to Branch Ads, the Branch Dashboard will enhance your analytics by adding cost-related parameters to your data. Through Branch's integration with specific ad partners, reports will be populated with the following analytics:
| Analytics Tag | Description | Used for |
|---|---|---|
| Cost | Total cost (spend) for those dimensions (analytics tags, user data, time range), regardless of cost model | Understanding the total amount spent |
| Revenue | Revenue attributed to your selected filters | Calculating how much money you've gained through commerce events |
| eCPI | cost / installs | Normalizing spend per install, to understand the average price of an install across networks or over time |
| eCPC | cost / clicks | Normalizing spend per click, to understand the average price of a click across networks or over time |
| eCPM | cost / (impressions / 1000) | Normalizing spend per thousand impressions, to understand the average price of 1000 impressions across networks or over time |
| eCPA | cost / purchases [includes web and app purchases] | Normalizing spend per purchase, to understand the average price of a purchase across networks or over time |
| Return On Investment (ROI) | (revenue-cost / cost) * 100 | Deriving return on investment, to understand the percentage "profit" made on ad spend |
| Return On Ad Spend (ROAS) | (revenue / cost) * 100 | Deriving return on investment by understanding the percentage revenue multiple for a given unit of spend |
Note
When looking at certain dimensions (ex. country), data may come in separately as Unpopulated. This is because different dimensions come from different forms in ingestion.
Metrics like Install and Cost are ingested by Branch from an ad partner, and it will have different dimensions.
Use this table to see what parameters are supported by which SAN.
Local currency
Attention
Branch's new experience is rolling out in phases, so your interface may differ. This section covers local currency in the legacy experience. For the new version, see General (New).
By default, the Branch Dashboard will generate reports in USD. In order to view revenue and cost in your local currency, please enable the Local Currency setting in your Branch Dashboard's Configuration. Additional details can be found here.
Local currency support in the Branch Dashboard will allow you to analyze marketing spend and revenue in your local currency. Additionally, it will allow for direct cost data comparison with ad partners who report their spending in a currency other than the USD.

With Local Currency enabled, you will gain new analytics tags as dimensions:
| Analytics Tag |
|---|
| Cost in App Local Currency |
| Revenue in Local Currency |
| eCPA in Local Currency |
| eCPC in Local Currency |
| eCPI in Local Currency |
| eCPM in Local Currency |
Tips and tricks
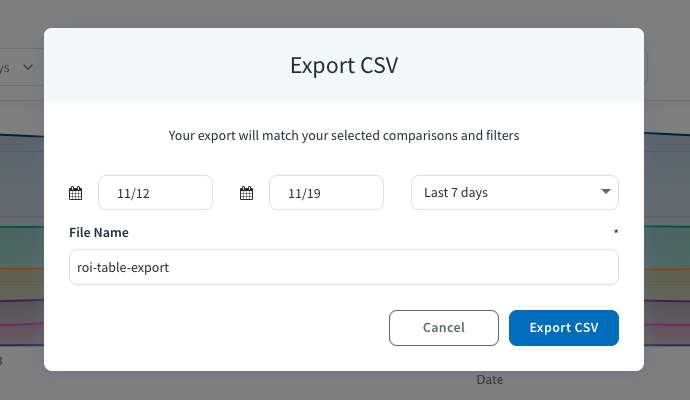
- You can export your current table view as a CSV file using the download button on the top right of the table.
- The Unique checkbox on both the graph and table views allows you to restrict reports to one event of each type per user. For example, take a user who clicked an ad link, then opened the app 7 times within the attribution window for that link. With the Unique box checked, we'd report one of those opens, with it unchecked, we'd report all 7.